AlphaExtract TradingView Indicators
Professional-grade technical indicators developed by AlphaExtract for TradingView. From advanced market structure analysis to machine learning models, these indicators help traders identify high-probability setups and market opportunities. All indicators are completely free to use and designed to enhance your investment strategies with institutional-quality analysis.
Showing 44 of 44 indicators

Wavelet-Trend ML Integration
Alpha-Extract Volatility Quality Indicator provides traders with deep insights into market volatility by measuring the directional strength of price movements. This sophisticated momentum-based tool helps identify overbought and oversold conditions.

Order Block Matrix
Identifies and visualizes key supply and demand zones on your chart, helping traders recognize potential reversal points and high-probability trading setups. Visualize key order blocks with volume profile histograms showing liquidity distribution.
![Advanced Chandelier Exit with S/R [Alpha Extract]](https://s3.tradingview.com/9/9X7UPWIx_mid.webp?v=1760086995)
Advanced Chandelier Exit with S/R [Alpha Extract]
Advanced Chandelier Exit with S/R is a precision-crafted trailing stop and market structure detection system that fuses advanced Chandelier Exit logic with intelligent, multi-timeframe support and resistance tracking. This indicator delivers adaptive trend detection, volatility-aware exit positioning, and real-time structural mapping in a clean, responsive format. By combining directional filtering, pivot zone detection, and customizable styling, Advanced Chandelier Exit with S/R is designed to give traders reliable context, strong risk management, and visually intuitive confirmation signals across all timeframes and asset classes.
![SMA MAD Trend [Alpha Extract]](https://s3.tradingview.com/c/CYHksAle_mid.webp?v=1766311135)
SMA MAD Trend [Alpha Extract]
A sophisticated trend identification system that combines Simple Moving Average with Mean Absolute Deviation methodology to create adaptive Super Trend-style bands with advanced strength filtering and gradient visualization. Utilizing ADX-based trend strength validation and slope analysis for signal quality enhancement, this indicator delivers institutional-grade trend detection with dynamic ATR-based ribbon visualization and comprehensive strength measurement. The system's dual-filter architecture eliminates false signals during weak or choppy market conditions while maintaining sensitivity to genuine trend establishment and reversal events.

Wyckoff Event Detection
A powerful and intelligent indicator designed to detect key Wyckoff events in real time, helping traders analyze market structure and anticipate potential trend shifts. Using volume and price action, this script automatically identifies distribution and accumulation phases.
![DEMA Flow [Alpha Extract]](https://s3.tradingview.com/e/En4W9675_mid.webp?v=1762597934)
DEMA Flow [Alpha Extract]
A sophisticated trend identification system that combines Double Exponential Moving Average methodology with advanced HL median filtering and ATR-based band detection for precise trend confirmation. Utilizing dual-layer smoothing architecture and volatility-adjusted breakout zones, this indicator delivers institutional-grade flow analysis with minimal lag while maintaining exceptional noise reduction. The system's intelligent band structure with asymmetric ATR multipliers provides clear trend state classification through price position analysis relative to dynamic threshold levels.
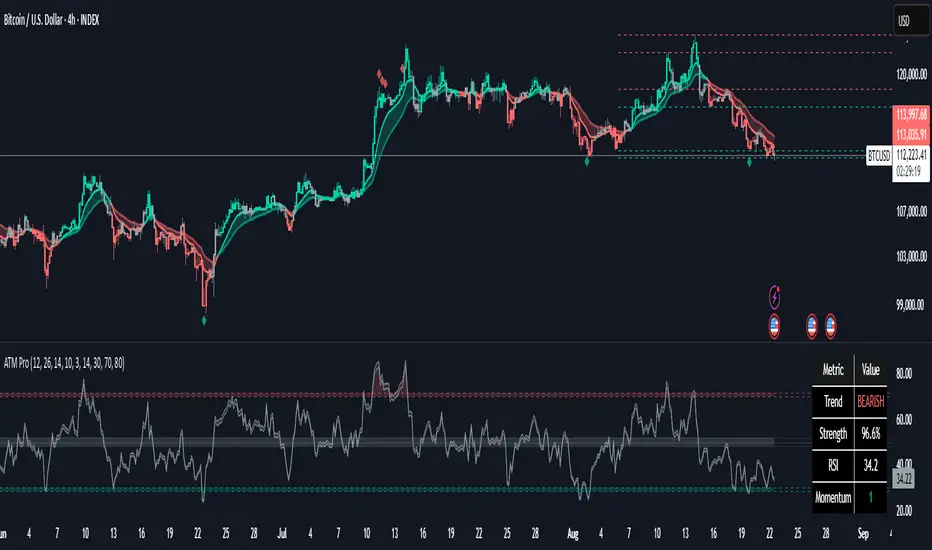
Advanced Trend Momentum
The Advanced Trend Momentum [Alpha Extract] indicator provides traders with deep insights into market dynamics by combining exponential moving average analysis with RSI momentum assessment and dynamic support/resistance detection. This sophisticated multi-dimensional tool helps identify trend changes, momentum divergences, and key structural levels, offering actionable buy and sell signals based on trend strength and momentum convergence.

Trend Strength Index
The Trend Strength Index leverages Volume Weighted Moving Average (VWMA) and Average True Range (ATR) to quantify trend intensity in cryptocurrency markets, particularly Bitcoin. The combination of VWMA and ATR is particularly powerful because VWMA provides a more accurate representation of the market's true average price by weighting periods of higher trading volume more heavily—capturing genuine momentum driven by increased participation rather than treating all price action equally, which is crucial in volatile assets like Bitcoin where volume spikes often signal institutional interest or market shifts.

Ultimate Market Structure
A comprehensive market structure analysis tool that combines advanced swing point detection, imbalance zone identification, and intelligent break analysis to identify high-probability trading opportunities. Utilizing a sophisticated trend scoring system, this indicator classifies market conditions and provides clear signals for structure breaks, directional changes, and fair value gap detection with institutional-grade precision.

Adaptive Trend Following Suite
A sophisticated multi-filter trend analysis system that combines advanced noise reduction, adaptive moving averages, and intelligent market structure detection to deliver institutional-grade trend following signals. Utilizing cutting-edge mathematical algorithms and dynamic channel adaptation, this indicator provides crystal-clear directional guidance with real-time confidence scoring and market mode classification for professional trading execution.

Impulse Volume Oscillator
A sophisticated indicator designed to identify market impulse moves and volume-based momentum shifts, helping traders capture significant price movements with precision. Combining price deviations with volume analysis, this oscillator dynamically measures market strength and weakness.

Bitcoin Monthly Seasonality
Analyzes historical Bitcoin price performance across different months of the year, enabling traders to identify seasonal patterns and potential trading opportunities. Visualize which months historically perform best and worst for Bitcoin.
![Baseline Deviation Oscillator [Alpha Extract]](https://s3.tradingview.com/o/OR5YF78q_mid.webp?v=1763285501)
Baseline Deviation Oscillator [Alpha Extract]
A sophisticated normalized oscillator system that measures price deviation from a customizable moving average baseline using ATR-based scaling and dynamic threshold adaptation. Utilizing advanced HL median filtering and multi-timeframe threshold calculations, this indicator delivers institutional-grade overbought/oversold detection with automatic zone adjustment based on recent oscillator extremes. The system's flexible baseline architecture supports six different moving average types while maintaining consistent ATR normalization for reliable signal generation across varying market volatility conditions.

Dual Channel System
A sophisticated trend-following and reversal detection system that constructs dynamic support and resistance channels using volatility-adjusted ATR calculations and EMA smoothing for optimal market structure analysis. Utilizing advanced dual-zone methodology with step-like boundary evolution, this indicator delivers institutional-grade channel analysis that adapts to varying volatility conditions while providing high-probability entry and exit signals through breakthrough and rejection detection with comprehensive visual mapping and alert integration.
![Mean Reversion Oscillator [Alpha Extract]](https://s3.tradingview.com/f/fEFvlTk2_mid.webp?v=1761044577)
Mean Reversion Oscillator [Alpha Extract]
An advanced composite oscillator system specifically designed to identify extreme market conditions and high-probability mean reversion opportunities, combining five proven oscillators into a single, powerful analytical framework.
![Momentum Tide [Alpha Extract]](https://s3.tradingview.com/6/6Rm7rtzu_mid.webp?v=1763891452)
Momentum Tide [Alpha Extract]
A sophisticated momentum-based trend identification system that measures normalized price deviation from an EMA baseline using ATR scaling and hyperbolic tangent smoothing for precise trend state classification. Utilizing advanced signal processing with configurable neutral bands and slope sensitivity adjustments, this indicator delivers institutional-grade momentum analysis with continuous strength measurement and visual trend confirmation. The system's three-state classification (bullish, bearish, neutral) combined with dynamic color intensity scaling provides comprehensive market momentum assessment across varying volatility conditions.

Stablecoin Supply Ratio
Compares Bitcoin's market capitalization to the aggregate supply of major stablecoins, offering insights into relative purchasing power and liquidity. Assess Bitcoin's buying power relative to the available stablecoin liquidity.
![Aggregated Scores Oscillator [Alpha Extract]](https://s3.tradingview.com/i/IoVwOtXh_mid.webp?v=1759491890)
Aggregated Scores Oscillator [Alpha Extract]
A sophisticated risk-adjusted performance measurement system that combines Omega Ratio and Sortino Ratio methodologies to create a comprehensive market assessment oscillator. Utilizing advanced statistical band calculations with expanding and rolling window analysis, this indicator delivers institutional-grade overbought/oversold detection based on risk-adjusted returns rather than traditional price movements. The system's dual-ratio aggregation approach provides superior signal accuracy by incorporating both upside potential and downside risk metrics with dynamic threshold adaptation for varying market conditions.

Aggregated Open Interest
Provides a comprehensive view of open interest across multiple cryptocurrency exchanges, allowing traders to monitor institutional positioning and market sentiment. By aggregating data from major exchanges like Binance, BitMEX, and Kraken.
![Oscillator Matrix [Alpha Extract]](https://s3.tradingview.com/g/gfUptPZd_mid.webp?v=1758888566)
Oscillator Matrix [Alpha Extract]
A comprehensive multi-oscillator system that combines volume-weighted money flow analysis with enhanced momentum detection, providing traders with a unified framework for identifying high-probability market opportunities across all timeframes. By integrating two powerful oscillators with advanced confluence analysis, this indicator delivers precise entry and exit signals while filtering out market noise through sophisticated threshold-based regime detection.

Enhanced Momentum Divergence Radar+
Designed to detect momentum shifts and divergence patterns, helping traders identify potential trend reversals and continuation points. By normalizing momentum readings and applying divergence detection, it enhances market timing for entries and exits.

Volume Profile Grid
A sophisticated volume distribution analysis system that transforms market activity into institutional-grade visual profiles, revealing hidden support/resistance zones and market participant behavior. Utilizing advanced price level segmentation, bullish/bearish volume separation, and dynamic range analysis, the Volume Profile Grid delivers comprehensive market structure insights with Point of Control (POC) identification, Value Area boundaries, and volume delta analysis. The system features intelligent visualization modes, real-time sentiment analysis, and flexible range selection to provide traders with clear, actionable volume-based market context.

MVRV Ratio
Provides valuable insights into Bitcoin market cycles by tracking the relationship between market value and realized value. This powerful on-chain metric helps traders identify potential market tops and bottoms, offering clear buy and sell signals based on historical patterns.
![Volume-Adjusted CCI Trend [Alpha Extract]](https://s3.tradingview.com/j/JfbEmbx3_mid.webp?v=1768130741)
Volume-Adjusted CCI Trend [Alpha Extract]
A sophisticated trend identification system that combines dual EMA direction analysis with volume-weighted normalization and CCI momentum filtering for comprehensive trend validation. Utilizing Volume RSI integration and standard deviation-based bands that expand and contract with volume characteristics, this indicator delivers institutional-grade trend detection with multi-layered confirmation requirements. The system's volume adjustment mechanism modulates signal sensitivity based on participation strength while CCI thresholds prevent false signals during weak momentum conditions, creating a robust trend-following framework with reduced whipsaw susceptibility.
![Liquidation Heatmap [Alpha Extract]](https://s3.tradingview.com/s/s1J1egRc_mid.webp?v=1765101598)
Liquidation Heatmap [Alpha Extract]
A sophisticated liquidity zone visualization system that identifies and maps potential liquidation levels based on swing point analysis with volume-weighted intensity measurement and gradient heatmap coloring. Utilizing pivot-based pocket detection and ATR-scaled zone heights, this indicator delivers institutional-grade liquidity mapping with dynamic color intensity reflecting relative liquidity concentration. The system's dual-swing detection architecture combined with configurable weight metrics creates comprehensive liquidation level identification suitable for strategic position planning and market structure analysis.
![FSVZO [Alpha Extract]](https://s3.tradingview.com/1/1fNn7CKo_mid.webp?v=1758293041)
FSVZO [Alpha Extract]
A sophisticated volume-weighted momentum oscillator that combines Fourier smoothing with Volume Zone Oscillator methodology to deliver institutional-grade flow analysis and divergence detection. Utilizing advanced statistical filtering including ADF trend analysis and multi-dimensional volume dynamics, this indicator provides comprehensive market sentiment assessment through volume-price relationships with extreme zone detection and intelligent divergence recognition for high-probability reversal and continuation signals.
![Liquidation Map [Alpha Extract]](https://s3.tradingview.com/r/RKeThOcV_mid.webp?v=1767520544)
Liquidation Map [Alpha Extract]
A sophisticated liquidity distribution visualization system that identifies potential liquidation zones through pivot-based detection and renders them as an interactive histogram with cumulative distance-to-liquidation curves. Utilizing multi-exchange volume aggregation and ATR-scaled pocket detection, this indicator delivers institutional-grade liquidity mapping with real-time histogram display showing relative concentration of long and short liquidation levels across configurable price ranges. The system's box-based rendering architecture combined with cumulative distribution overlays provides comprehensive visual assessment of asymmetric liquidity positioning for strategic trade planning.

EMA Oscillator
A precision mean reversion analysis tool that combines advanced Z-score methodology with dual threshold systems to identify extreme price deviations from trend equilibrium. Utilizing sophisticated statistical normalization and adaptive percentage-based thresholds, this indicator provides high-probability reversal signals based on standard deviation analysis and dynamic range calculations with institutional-grade accuracy for systematic counter-trend trading opportunities.

AE - ATR Exhaustion Channel
A powerful volatility-based trading tool that combines an averaged SMA with ATR bands to dynamically highlight potential trend exhaustion zones. It provides real-time breakout detection by marking when price moves beyond expected volatility ranges.
![Guppy MMA [Alpha Extract]](https://s3.tradingview.com/f/F2rD2YiC_mid.webp?v=1757674070)
Guppy MMA [Alpha Extract]
A sophisticated trend-following and momentum assessment system that constructs dynamic trader and investor sentiment channels using multiple moving average groups with advanced scoring mechanisms and smoothed CCI-style visualizations for optimal market trend analysis. Utilizing enhanced dual-group methodology with threshold-based trend detection, this indicator delivers institutional-grade GMMA analysis that adapts to varying market conditions while providing high-probability entry and exit signals through crossover and extreme value detection with comprehensive visual mapping and alert integration.

Volatility Quality
Provides traders with deep insights into market volatility by measuring the directional strength of price movements. This sophisticated momentum-based tool helps identify overbought and oversold conditions, offering actionable buy and sell signals based on volatility trends.

Ehlers Adaptive Trend Indicator
Combines Ehlers' advanced digital signal processing techniques with dynamic volatility bands to identify robust trend conditions and potential reversals. This powerful tool helps traders visualize trend strength, adaptive support/resistance levels, and momentum shifts.

Heikin-Ashi Mean Reversion Oscillator
Combines the smoothing characteristics of Heikin-Ashi candlesticks with mean reversion analysis to create a powerful momentum oscillator. This indicator applies Heikin-Ashi transformation twice - first to price data and then to the oscillator itself.

Advanced Support & Resistance
A sophisticated yet user-friendly tool designed to enhance your trading analysis by accurately identifying and plotting key support and resistance levels. Built on a unique pivot-based detection algorithm, this indicator provides clear visual cues in real time.

Neural Pulse System
A custom technical indicator that analyzes price action through a probabilistic lens, offering a dynamic view of bullish and bearish tendencies. Unlike traditional binary classification models, NPS employs Ordinary Least Squares (OLS) regression with dynamically computed coefficients.

Market Regime Matrix
A sophisticated market regime classification system that combines multiple technical analysis components into an intelligent scoring framework to identify and track dominant market conditions. Utilizing advanced ADX-based trend detection, EMA directional analysis, volatility assessment, and crash protection protocols, the Market Regime Matrix delivers institutional-grade regime classification with BULL, BEAR, and CHOP states. The system features intelligent scoring with smoothing algorithms, duration filters for stability, and structure-based conviction adjustments to provide traders with clear, actionable market context.
![Sharpe Ratio [Alpha Extract]](https://s3.tradingview.com/5/5wL3AjMQ_mid.webp?v=1769344062)
Sharpe Ratio [Alpha Extract]
A sophisticated risk-adjusted return measurement system that calculates annualized Sharpe Ratio with dynamic color-coded visualization distinguishing return quality across positive and negative performance regimes. Utilizing rolling period calculations with smoothed moving average comparison, this indicator delivers institutional-grade performance assessment with overbought/oversold threshold detection for extreme risk-adjusted return conditions. The system's four-tier color classification combined with histogram fills and background highlighting provides comprehensive visual feedback on whether current returns justify their volatility risk across varying market cycles.
![Dynamic Fractal Flow [Alpha Extract]](https://s3.tradingview.com/n/nx3U4ig3_mid.webp?v=1761910484)
Dynamic Fractal Flow [Alpha Extract]
An advanced momentum oscillator that combines fractal market structure analysis with adaptive volatility weighting and multi-derivative calculus to identify high-probability trend reversals and continuation patterns. Utilizing sophisticated noise filtering through choppiness indexing and efficiency ratio analysis, this indicator delivers entries that adapt to changing market regimes while reducing false signals during consolidation via multi-layer confirmation centered on acceleration analysis, statistical band context, and dynamic omega weighting—without any divergence detection.
![MAD Supertrend [Alpha Extract]](https://s3.tradingview.com/f/FeHr5Z3r_mid.webp?v=1768729215)
MAD Supertrend [Alpha Extract]
A sophisticated SuperTrend implementation that replaces traditional ATR calculations with Mean Absolute Deviation methodology for adaptive volatility measurement and band construction. Utilizing SMA baseline with MAD-based deviation bands and optional adaptive factor adjustments, this indicator delivers institutional-grade trend detection with strength-based filtering and dynamic visual feedback. The system's MAD approach provides superior noise reduction compared to ATR while maintaining responsiveness to genuine volatility changes, combined with momentum-based strength calculations for high-conviction signal generation.

OBV Trend Bands
Leverages On-Balance Volume (OBV) to assess trend strength and potential reversals by plotting a dynamic median line alongside upper and lower bands based on standard deviation. This tool helps traders identify overbought or oversold conditions.
![Market Entropy [Alpha Extract]](https://s3.tradingview.com/m/MjsAv8rm_mid.webp?v=1766925841)
Market Entropy [Alpha Extract]
A sophisticated information theory-based market analysis system that measures price randomness and structural order using Shannon entropy calculations across price, returns, and volume distributions. Utilizing adaptive percentile-based thresholds and multi-timeframe confirmation, this indicator delivers institutional-grade regime classification distinguishing between structured trending conditions and chaotic ranging environments. The system's composite entropy framework combined with dynamic gradient visualization and MTF alignment validation provides comprehensive market state assessment for optimal strategy selection and risk management.

Dynamic Adaptive Moving Average
An adaptive technical tool that automatically discovers the optimal moving average period based on forward-looking price behavior. Unlike traditional fixed-length moving averages, this indicator continuously evaluates multiple timeframes.
![USDT Market Cap Change [Alpha Extract]](https://s3.tradingview.com/h/hfbwTIEM_mid.webp?v=1765701040)
USDT Market Cap Change [Alpha Extract]
A sophisticated stablecoin market analysis tool that tracks USDT market capitalization changes across daily and 60-day periods with statistical normalization and gradient intensity visualization. Utilizing z-score methodology for overbought/oversold detection and dynamic color gradients reflecting change magnitude, this indicator delivers institutional-grade market liquidity assessment through stablecoin flow analysis. The system's dual-timeframe approach combined with statistical normalization provides comprehensive market sentiment measurement based on capital inflows and outflows from the dominant stablecoin.
![Gold Fair Value [Alpha Extract]](https://s3.tradingview.com/k/KKoGkNkI_mid.webp?v=1764498412)
Gold Fair Value [Alpha Extract]
Gold-anchored Bitcoin fair value model is a macro-fundamental valuation indicator that anchors Bitcoin price assessment to gold market dynamics, establishing fair value zones through percentage change influence modelling and adaptive band multipliers. This overlay system provides institutional-grade context for identifying accumulation zones, distribution zones, and fair value equilibrium across all market cycles with minimal chart clutter through sophisticated gradient fill visualization.